
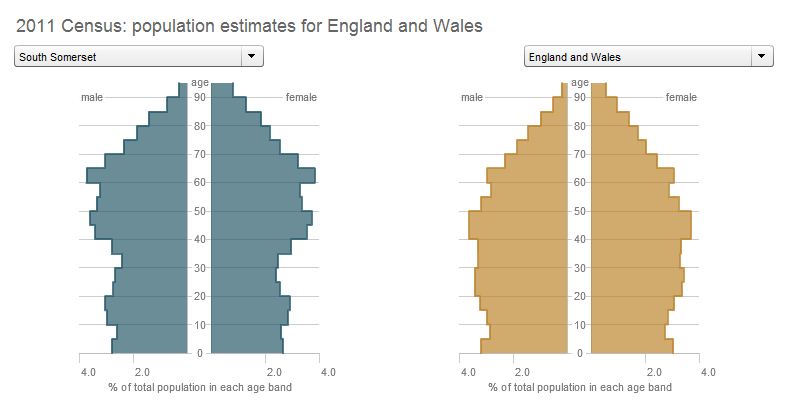
This comparison of the local age distribution with the national picture shows a “waist” as young people move away to study or to find work followed by a bulge further up where they return with their families, and they stay until old age. The 2011 Census also shows that as a nation we’re living much longer: 16.4 per centof the population is aged 65 and over, that is one in six people in the population was 65 and over. There were 430,000 residents aged 90 and over in 2011 (compared with 340,000 in 2001 and 13,000 in 1911).
The slight surprise in these “actual count” Census numbers is that they’re higher than the “population estimates” that government has been using for planning purposes. This confirms the need for the growth in the proposed South Somerset Local Plan, which is currently out to public consultation until 10th August. Fortunately, the plan was designed to be flexible, so that if growth was higher than expected, control would not be lost and the plan would still be coherent.
No matter what “The Sun” says, this increase in population is isn’t caused by “Eastern European Immigrants” (though they are mixed in), the trend has been going on for more than a hundred years.

The ONS have also produced some fantastic Census visualisation tools such as this interactive chart which shows how the two World Wars affected the population distribution (just look at the “notches” as you slide the slider). Another chart shows the internal migration to and from South Somerset. Finally, take a look at the fertility rates over the years. Things are not going to get better!
http://www.ons.gov.uk/ons/guide-method/census/2011/index.html